
1、Nginx日志分析系统
1.1、项目需求
Nginx是一款非常优秀的web服务器,往往nginx服务会作为项目的访问入口,那么,nginx的性能保障就变得非常重要了,如果nginx的运行出现了问题就会对项目有较大的影响,所以,我们需要对nginx的运行有监控措施,实时掌握nginx的运行情况,那就需要收集nginx的运行指标和分析nginx的运行日志了。
1.2、业务流程
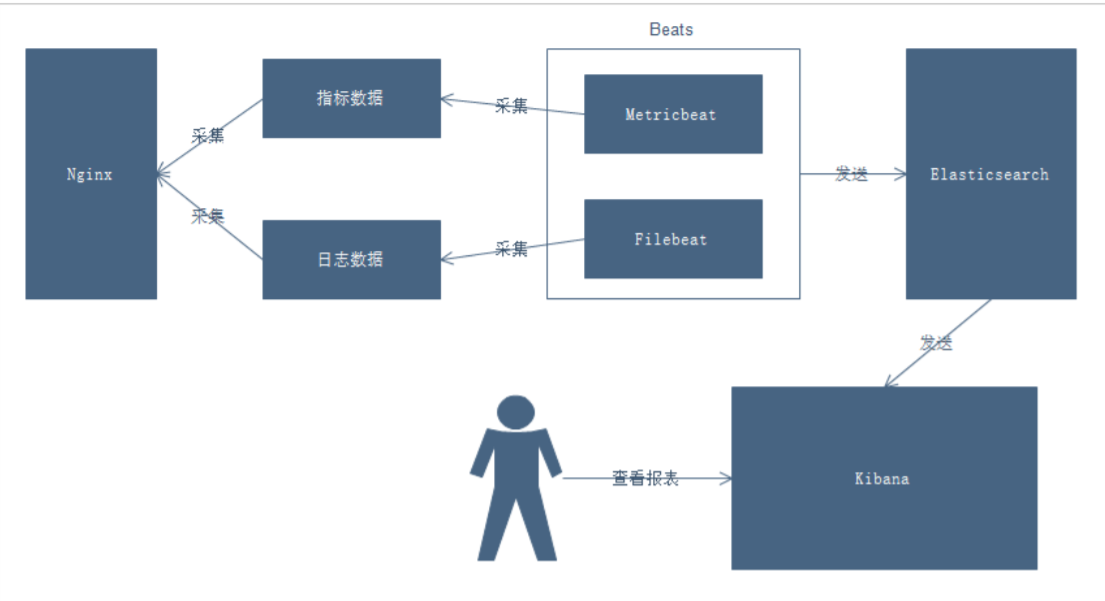
说明:
* 通过Beats采集Nginx的指标数据和日志数据
* Beats采集到数据后发送到Elasticsearch中
* Kibana读取数据进行分析
* 用户通过Kibana进行查看分析报表
2、部署安装Nginx
1. 上传nginx
sudo rz
2. 解压nginx
tar -xvf nginx-1.11.6.tar.gz
3. 安装nginx需要的环境
yum -y install gcc
yum -y install gcc-c++
yum install pcre-devel
yum install zlib-devel
yum install openssl openssl-devel
yum install perl-Digest-SHA1.x86_64
4. 编译nginx
./configure --with-http_stub_status_module --with-http_ssl_module
make
make install
5. 启动nginx
cd /usr/local/nginx/sbin/
./nginx
6. #通过浏览器访问页面并且查看日志(ip)
#访问地址:http://master/
7. 查看日志
8. cd logs/
tail -f /usr/local/nginx/logs/access.log
3、Beats 简介
官网:https://www.elastic.co/cn/products/beats
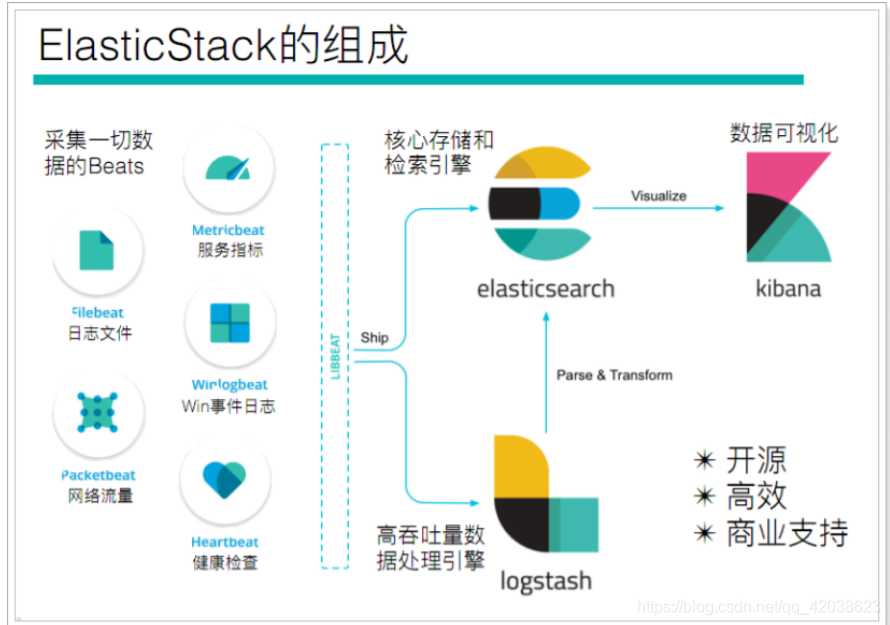

Beats系列产品

4、Filebeat
4.1、架构
用于监控、收集服务器日志文件.

4.2、部署与运行
下载(或使用资料中提供的安装包,版本为:filebeat-6.5.4):https://www.elastic.co/downloads/beats
1. 上传filebeat-6.5.4
mkdir beats
cd beats/
sudo rz
2. 解压filebeat-6.5.4
tar -xvf filebeat-6.5.4-linux-x86_64.tar.gz
3.#创建如下配置文件 itcast.yml

filebeat.inputs:
- type: stdin
  enabled: true
setup.template.settings:
  index.number_of_shards: 3
output.console:
  pretty: true
  enable: true

4. 启动filebeat
./filebeat -e -c itcast.yml
5.输入hello运行结果如下:
hello

{
  "@timestamp": "2020-04-16T17:40:05.899Z",
  "@metadata": {
    "beat": "filebeat",
    "type": "doc",
    "version": "6.5.4"
  },
  "message": "hello",
  "prospector": {
    "type": "stdin"
  },
  "input": {
    "type": "stdin"
  },
  "beat": {
    "name": "master",
    "hostname": "master",
    "version": "6.5.4"
  },
  "host": {
    "name": "master"
  },
  "source": "",
  "offset": 0
}
4.3、读取文件
#配置读取文件项 itcast-log.yml

filebeat.inputs:
- type: log
  enabled: true
  paths:
   - /usr/local/beats/logs/*.log
setup.template.settings:
  index.number_of_shards: 3
output.console:
  pretty: true
  enable: true

#前提:要有/usr/local/beats/logs这个文件夹

#启动filebeat
./filebeat -e -c itcast-log.yml

## 在/usr/local/beats/logs这个文件夹创建  .log文件
并且输入信息
echo "124" >> a.log

# 这时候客户端filebeat就会实时监控输出
2020-04-17T02:24:48.708+0800    INFO    log/harvester.go:254    Harvester started for file: /usr/local/beats/logs/a.log
{
  "@timestamp": "2020-04-16T18:24:48.708Z",
  "@metadata": {
    "beat": "filebeat",
    "type": "doc",
    "version": "6.5.4"
  },
  "tags": [
    "web",
    "test"
  ],
  "input": {
    "type": "log"
  },
  "from": "wed_kt",
  "beat": {
    "name": "master",
    "hostname": "master",
    "version": "6.5.4"
  },
  "offset": 57,
  "source": "/usr/local/beats/logs/a.log",
  "prospector": {
    "type": "log"
  },
  "host": {
    "name": "master"
  },
  "message": "我又来了"
}
可以看出,已经检测到日志文件有更新,立刻就会读取到更新的内容,并且输出到控制台。
4.4、自定义字段
#配置读取文件项 itcast-log.yml

filebeat.inputs:
- type: log
  enabled: true
  paths:
   - /usr/local/beats/logs/*.log
  tags: ["web","test"]   #添加自定义tag,便于后续的处理
  fields: wen_kt    #添加自定义字段
  fields_under_root: true   #true为添加到根节点,false为添加到子节点中
setup.template.settings:
  index.number_of_shards: 3
output.console:
  pretty: true
  enable: true

#可以观察到执行效果发生变化
4.5、输出到Elasticsearch
#配置读取文件项 itcast-log.yml

filebeat.inputs:
- type: log
  enabled: true
  paths:
   - /usr/local/beats/logs/*.log
  tags: ["web","test"]
  fields:
    from:  wed_kt
  fields_under_root: true
setup.template.settings:
  index.number_of_shards: 3
output.elasticsearch:
  hosts: ["192.168.119.129","192.168.119.130","192.168.119.131","192.168.119.132"]
#output.console:
# pretty: true
#  enable: true

#启动
./filebeat -e -c itcast-log.yml
#在a.log中添加信息
 echo "我来了" >> a.log
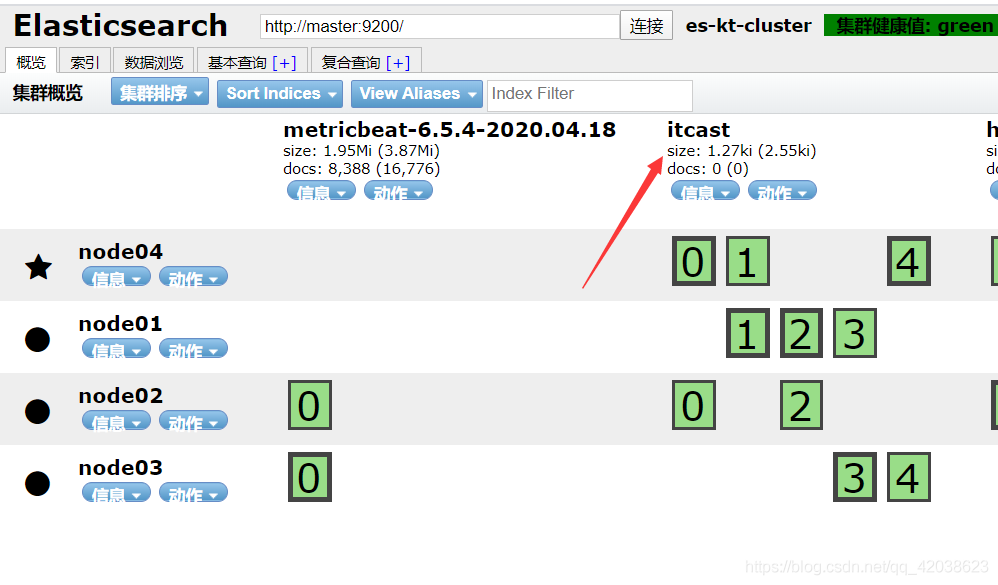
可以观察到执行效果发生变化在elastSearch中输出了数据
在elastSearch集群中也可以看点新建了对应的索引,并且添加了数据
4.6、Filebeat工作原理
Filebeat由两个主要组件组成:prospector 和 harvester。
* harvester:
* 负责读取单个文件的内容。
* 如果文件在读取时被删除或重命名,Filebeat将继续读取文件。
* prospector
* prospector 负责管理harvester并找到所有要读取的文件来源。
* 如果输入类型为日志,则查找器将查找路径匹配的所有文件,并为每个文件启动一个harvester。
* Filebeat目前支持两种prospector类型:log和stdin。
* Filebeat如何保持文件的状态
* Filebeat 保存每个文件的状态并经常将状态刷新到磁盘上的注册文件中。
* 该状态用于记住harvester正在读取的最后偏移量,并确保发送所有日志行。
* 如果输出(例如Elasticsearch或Logstash)无法访问,Filebeat会跟踪最后发送的行,并在输出再次可用时继续读取文件。
* 在Filebeat运行时,每个prospector内存中也会保存的文件状态信息,当重新启动Filebeat时,将使用注册文件的数据来重建文件状态,Filebeat将每个harvester在从保存的最后偏移量继续读取。
* 文件状态记录在data/registry文件中。
#启动命令:
./filebeat -e -c itcast.yml
./filebeat -e -c itcast.yml -d "publish"

#参数说明
-e: 输出到标准输出,默认输出到syslog和logs下
-c: 指定配置文件
-d: 输出debug信息

#测试: ./filebeat -e -c itcast-log.yml -d "publish"
4.7、读取Nginx日志文件
# 新建 itcast-nginx.yml

filebeat.inputs:
- type: log
  enabled: true
  paths:
   - /usr/local/nginx/logs/*.log
  tags: ["nginx"]
setup.template.settings:
  index.number_of_shards: 5
output.elasticsearch:
  hosts: ["192.168.119.129","192.168.119.130","192.168.119.131","192.168.119.132"]
#output.console:
# pretty: true
#  enable: true


#启动
./filebeat -e -c itcast-nginx.yml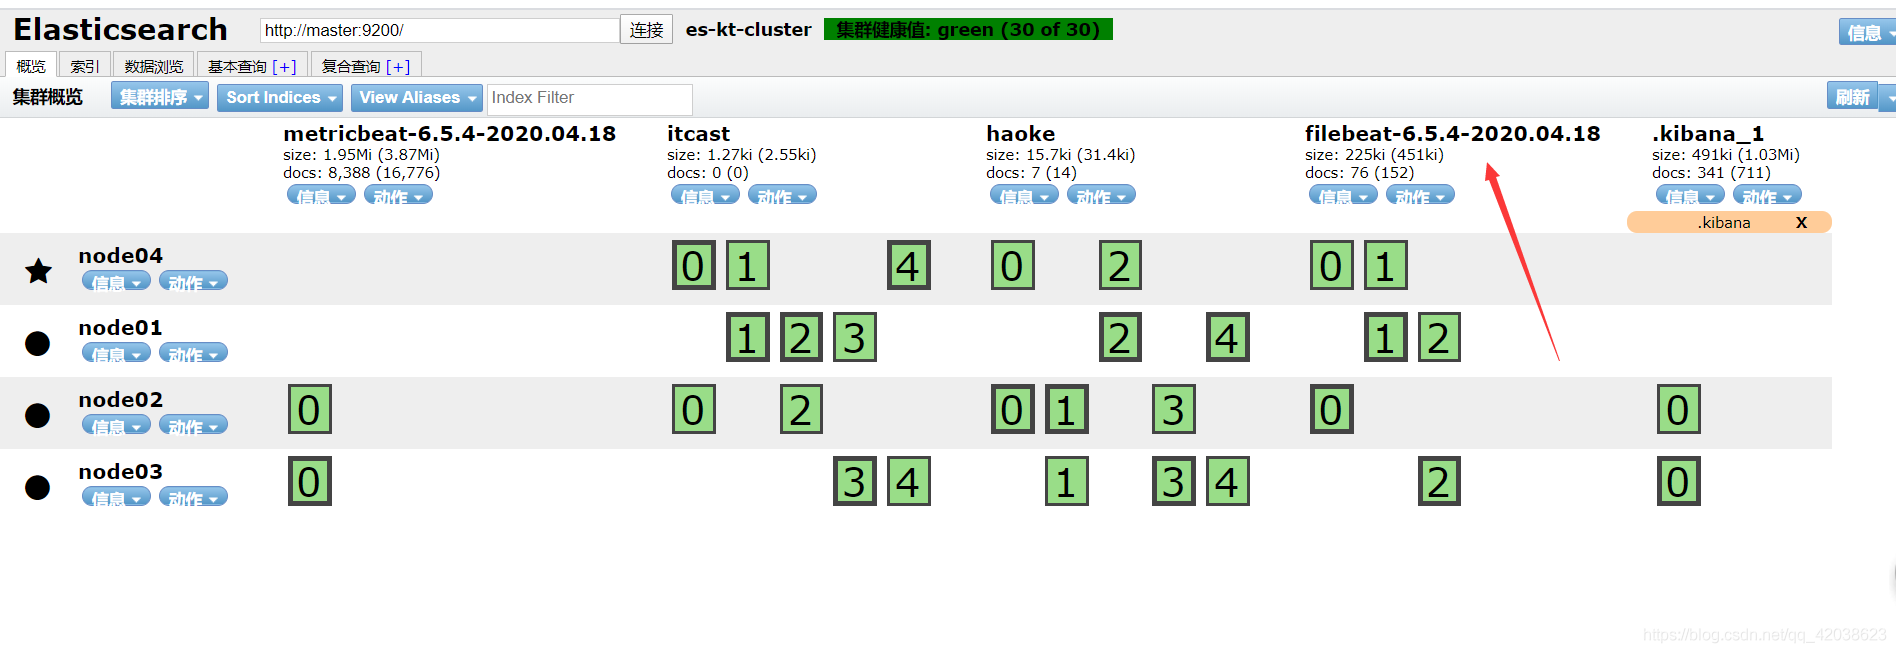
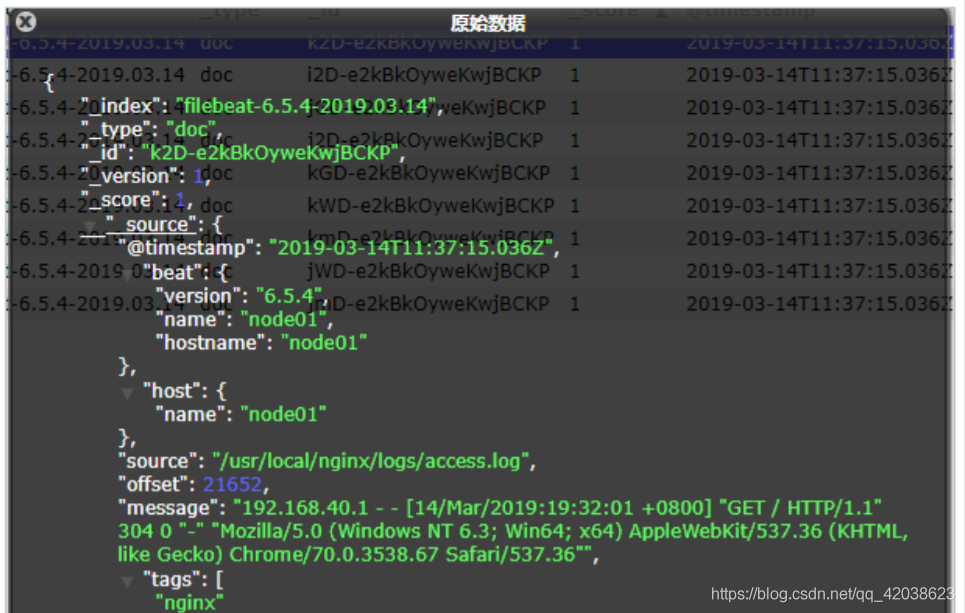
可以看到,在message中已经获取到了nginx的日志,但是,内容并没有经过处理,只是读取到原数据
4.7、Module
要想实现日志数据的读取以及处理都是自己手动配置的,其实,在Filebeat中,有大量的Module,可以简化我们的配置,直接就可以使用,如下
/filebeat modules list
Enabled:
Disabled:
apache2
auditd
elasticsearch
haproxy
icinga
iis
kafka
kibana
logstash
mongodb
mysql
nginx
osquery
postgresql
redis
suricata
system
traefik
可以看到,内置了很多的module,但是都没有启用,如果需要启用需要进行enable操作:
./filebeat modules enable nginx #启动
./filebeat modules disable nginx #禁用
Enabled:
nginx
Disabled:
apache2
auditd
elasticsearch
haproxy
icinga
iis
kafka
kibana
logstash
mongodb
mysql
redis
osquery
postgresql
suricata
system
traefik
可以发现,nginx的module已经被启用
4.7.1、nginx module 配置
cd modules.d/
vim nginx.yml

- module: nginx
  # Access logs
  access:
    enabled: true
    var.paths: ["/usr/local/nginx/logs/access.log*"]
    # Set custom paths for the log files. If left empty,
    # Filebeat will choose the paths depending on your OS.
    #var.paths:

  # Error logs
  error:
    enabled: true
    var.paths: ["/usr/local/nginx/logs/error.log*"]
    # Set custom paths for the log files. If left empty,
    # Filebeat will choose the paths depending on your OS.
    #var.paths:
4.7.2、配置filebeat
vim itcast-nginx.yml

filebeat.inputs:
#- type: log
#  enabled: true
#  paths:
#   - /usr/local/nginx/logs/*.log
#  tags: ["nginx"]
setup.template.settings:
  index.number_of_shards: 5
output.elasticsearch:
  hosts: ["192.168.119.129","192.168.119.130","192.168.119.131","192.168.119.132"]
filebeat.config.modules:
  path: ${path.config}/modules.d/*.yml
  reload.enabled: false
#output.console:
# pretty: true
#  enable: true
4.7.3、测试
#启动会出错,如下
ERROR fileset/factory.go:142 Error loading pipeline: Error loading pipeline for
fileset nginx/access: This module requires the following Elasticsearch plugins:
ingest-user-agent, ingest-geoip. You can install them by running the following
commands on all the Elasticsearch nodes:
sudo bin/elasticsearch-plugin install ingest-user-agent
sudo bin/elasticsearch-plugin install ingest-geoip

#解决:需要在Elasticsearch中安装ingest-user-agent、ingest-geoip插件
#在资料中可以找到,ingest-user-agent.tar、ingest-geoip.tar、ingest-geoip-conf.tar 3个文件
#其中,ingest-user-agent.tar、ingest-geoip.tar解压到plugins下
#ingest-geoip-conf.tar解压到config下
四个虚拟机节点都要安装这些插件
scp转发就行了
#问题解决。
4.7.4、启动fileset的nginx日志收集
- 先要启动elastSearch集群 /bin./elasticsearch
- 然后启动Filebeat ./filebeat -e -c itcast-nginx.yml
- 启动nginx
cd usr/local/nginx/sbin
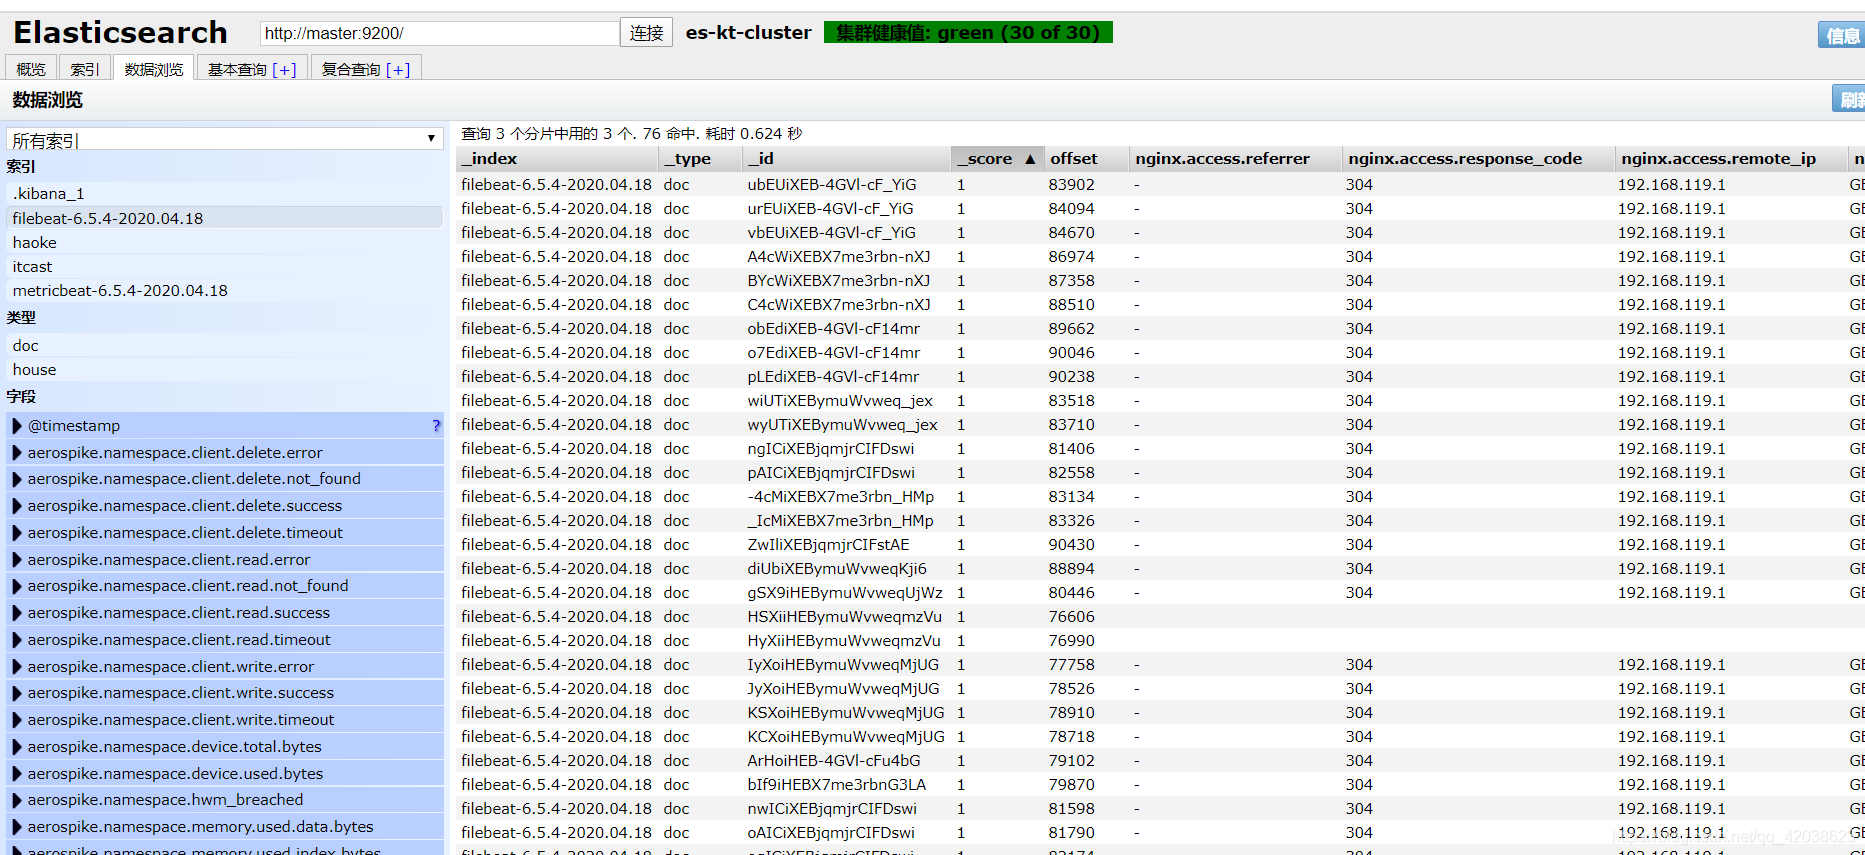
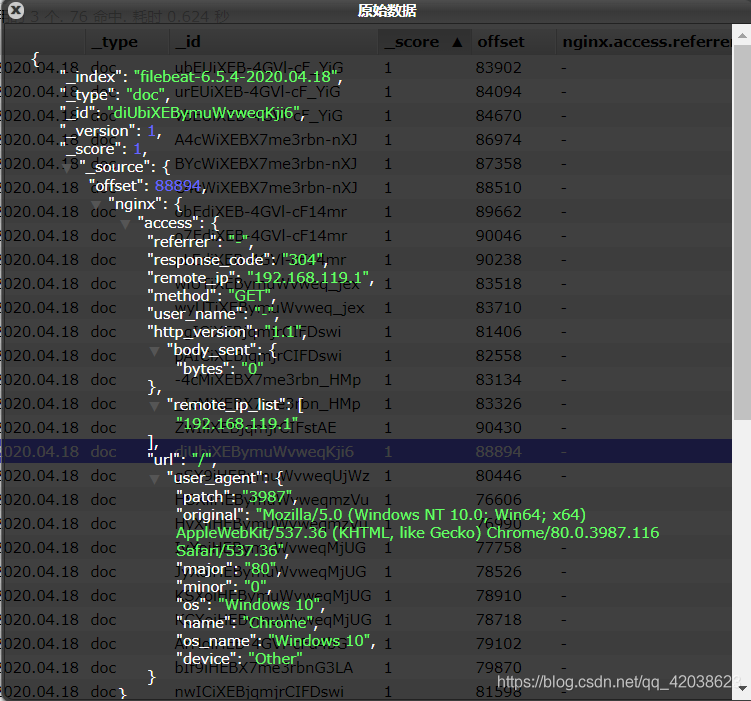
./nginx - 在浏览器刷新就可以发现nginx日志信息收集并且整理在elastSearsh中
5、Metricbeat

- 定期收集操作系统或应用服务的指标数据
- 存储到Elasticsearch中,进行实时分析
5.1、Metricbeat组成
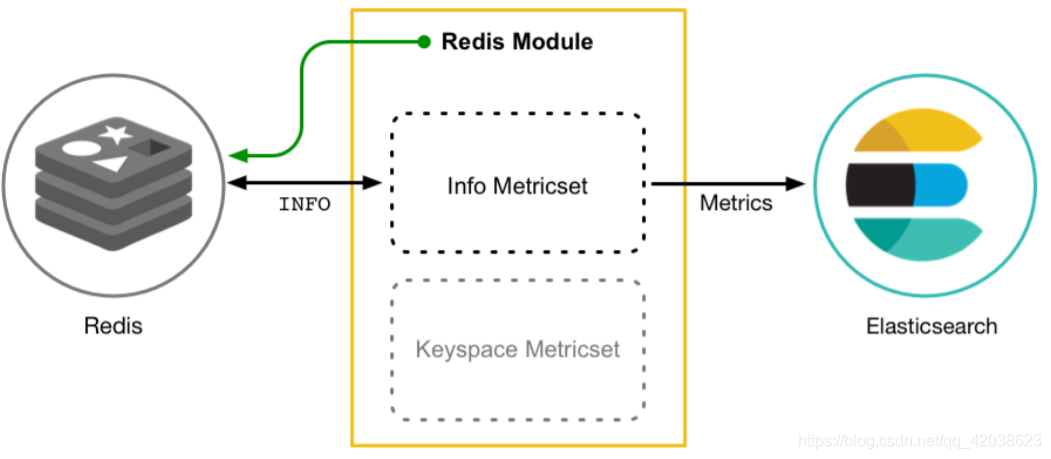
Metricbeat有2部分组成,一部分是Module,另一部分为Metricset。
- Module
收集的对象,如:mysql、redis、nginx、操作系统等;
- Metricset
收集指标的集合,如:cpu、memory、network等;
以Redis Module为例:
5.2、部署与收集系统指标
#上传metricbeat-6.5.4-linux-x86_64.tar.gz
sudo rz
#解压
tar -xvf metricbeat-6.5.4-linux-x86_64.tar.gz
cd metricbeat-6.5.4-linux-x86_64
#配置
vim metricbeat.yml
找到output.elasticsearch:
hosts: ["master:9200","salve1:9200","salve2:9200","salve3:9200"]
#启动
./metricbeat -e
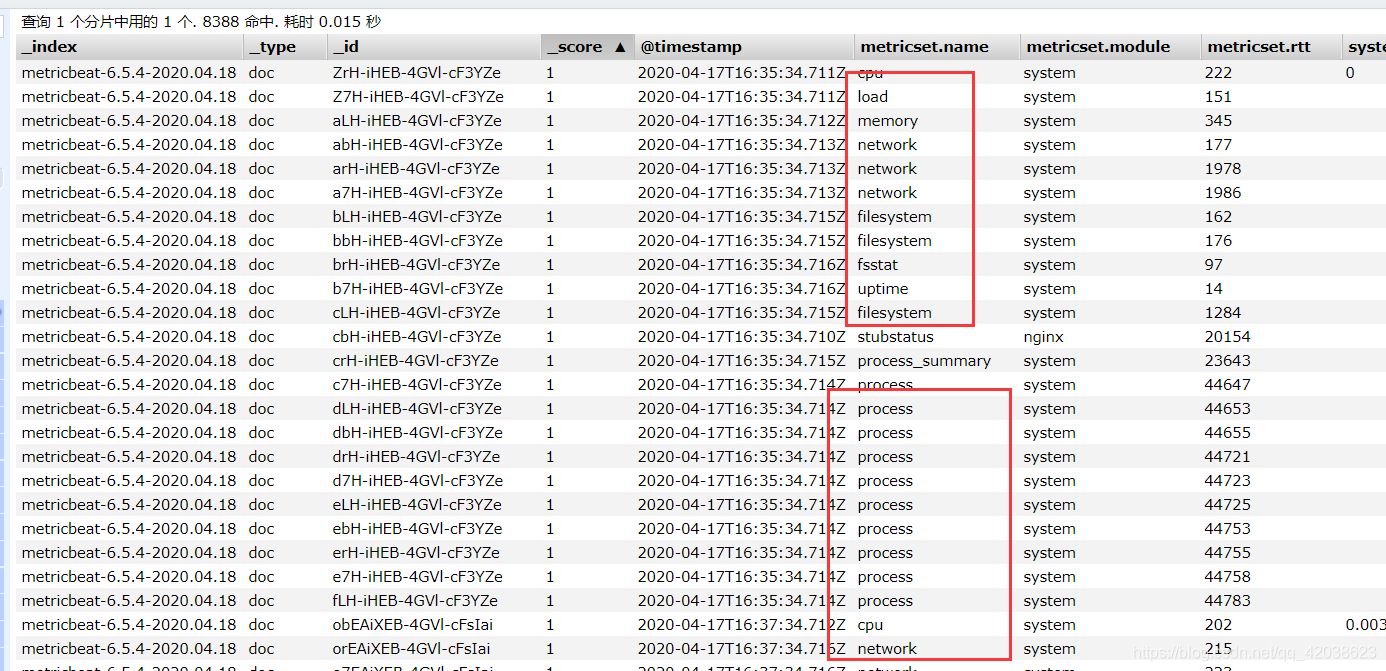
在ELasticsearch中可以看到,系统的一些指标数据已经写入进去了:
5.3、Module
./metricbeat modules list #查看列表
Enabled:
system #默认启用
Disabled:
aerospike
apache
ceph
couchbase
...
5.4、Nginx Module
5.4.1、开启nginx的状态查询
#重新编译nginx
./configure --prefix=/usr/local/nginx --with-http_stub_status_module
make
make install

./nginx -V #查询版本信息
nginx version: nginx/1.11.6
built by gcc 4.4.7 20120313 (Red Hat 4.4.7-23) (GCC)
configure arguments: --prefix=/usr/local/nginx --with-http_stub_status_module

#配置nginx
vim nginx.conf
location /nginx-status {
stub_status on;
access_log off;
}
测试
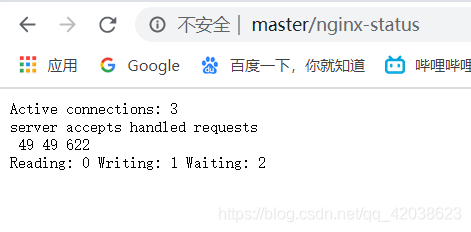
结果说明:
* Active connections:正在处理的活动连接数
* server accepts handled requests
* 第一个 server 表示Nginx启动到现在共处理了9个连接
* 第二个 accepts 表示Nginx启动到现在共成功创建 9 次握手
* 第三个 handled requests 表示总共处理了 21 次请求
* 请求丢失数 = 握手数 - 连接数 ,可以看出目前为止没有丢失请求
* Reading: 0 Writing: 1 Waiting: 1
* Reading:Nginx 读取到客户端的 Header 信息数
* Writing:Nginx 返回给客户端 Header 信息数
* Waiting:Nginx 已经处理完正在等候下一次请求指令的驻留链接(开启keep-alive的情况下,这个值等于
Active - (Reading+Writing))
5.4.2、配置Nginx Module
#启用metricbeat module
./metricbeat modules enable nginx
#修改redis module配置
vim modules.d/nginx.yml

# Module: nginx
# Docs: https://www.elastic.co/guide/en/beats/metricbeat/6.5/metricbeat-module-nginx.html

- module: nginx
  #metricsets:
  #  - stubstatus
  period: 10s

  # Nginx hosts
  # hosts: ["http://127.0.0.1"]
  hosts: ["http://master/"]

  # Path to server status. Default server-status
  #server_status_path: "server-status"
  server_status_path: "nginx-status"

  #username: "user"
  #password: "secret"

#启动
./metricbeat -e
测试:
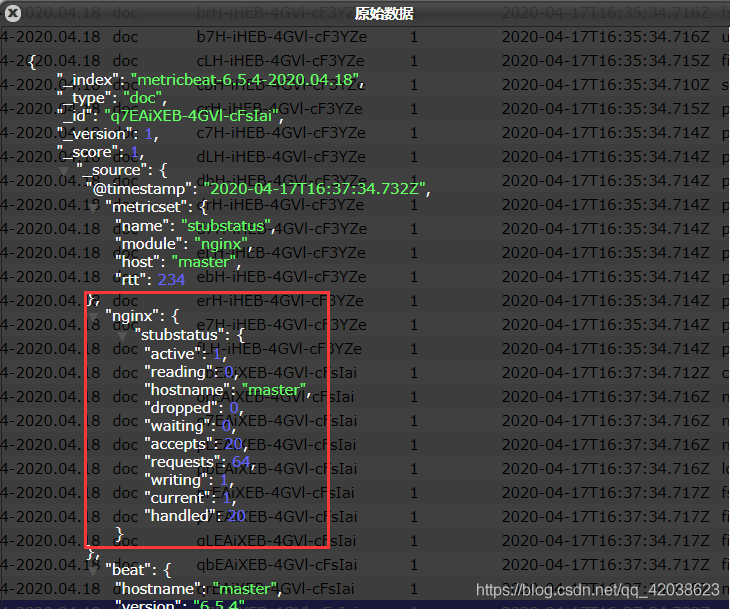
可以看到,nginx的指标数据已经写入到了Elasticsearch。
更多的Module使用参见官方文档:
https://www.elastic.co/guide/en/beats/metricbeat/current/metricbeat-modules.html
6、Kibana

Kibana 是一款开源的数据分析和可视化平台,它是 Elastic Stack 成员之一,设计用于和 Elasticsearch 协作。您可以
使用 Kibana 对 Elasticsearch 索引中的数据进行搜索、查看、交互操作。您可以很方便的利用图表、表格及地图对
数据进行多元化的分析和呈现。
官网:https://www.elastic.co/cn/products/kibana
6.1、配置安装
# 上传安装包
sudo rz
#解压安装包
tar -xvf kibana-6.5.4-linux-x86_64.tar.gz
#修改配置文件
vim config/kibana.yml
server.host: "master" #对外暴露服务的地址
elasticsearch.url: "http://master:9200" #配置Elasticsearch
#启动
./bin/kibana
#通过浏览器进行访问
http://192.168.40.133:5601/app/kibana
可以看到kibana页面,并且可以看到提示,导入数据到Kibana。
6.2、功能说明

6.3、数据探索
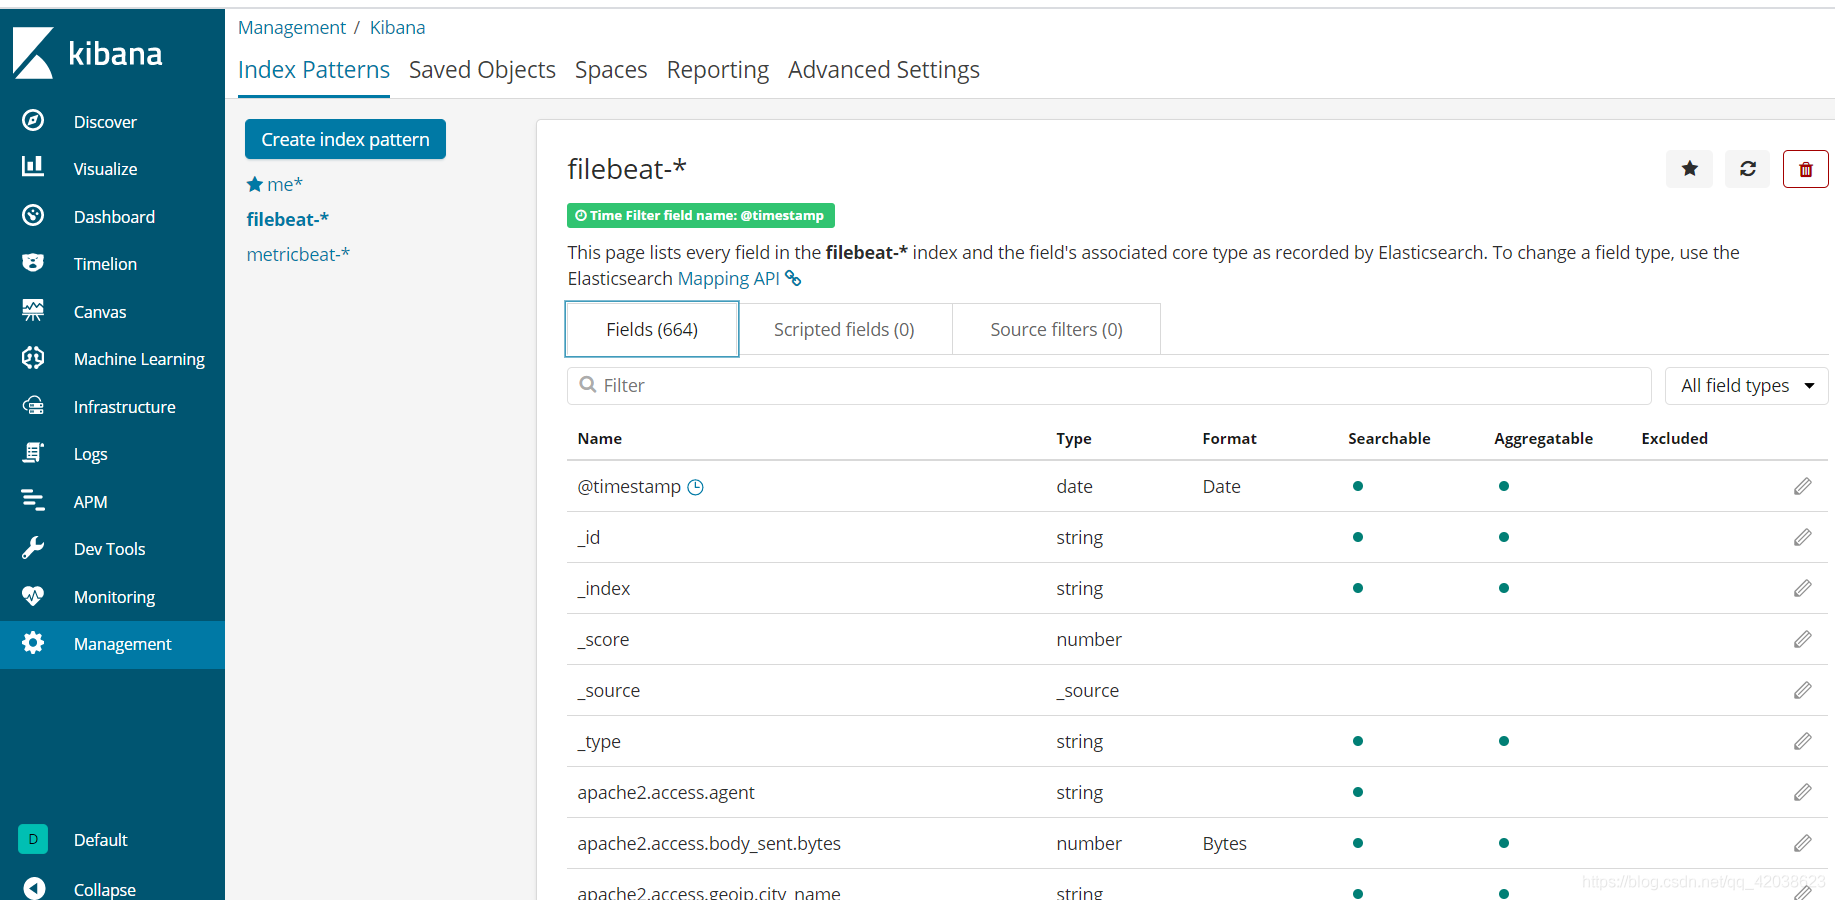
首先先添加索引信息:
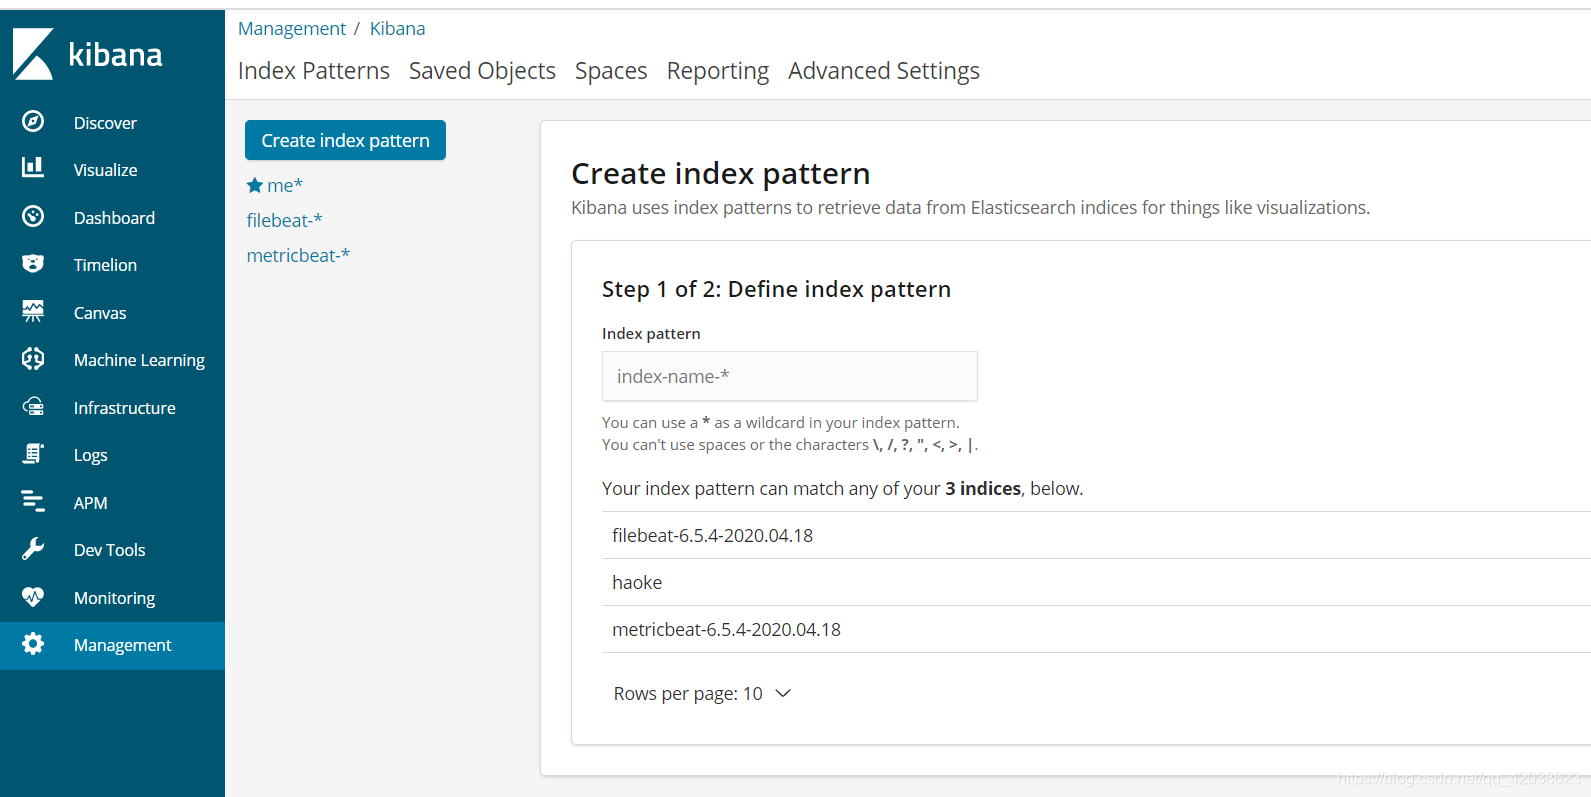
即可查看索引数据:
6.4、Metricbeat 仪表盘
可以将Metricbeat的数据在Kibana中展示
#修改metricbeat配置
vim
setup.kibana:
  host: "http://master:5601"
#安装仪表盘到Kibana
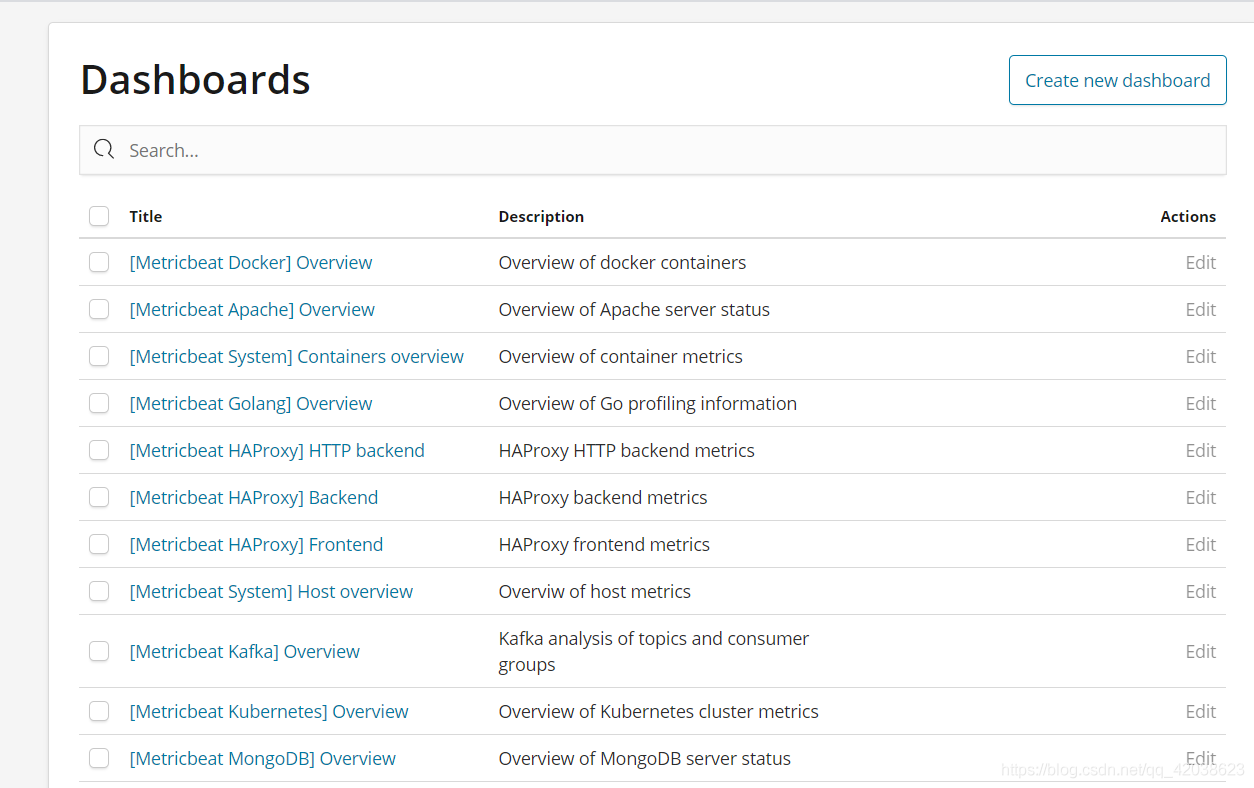
./metricbeat setup --dashboards
即可在Kibana中看到仪表盘数据:
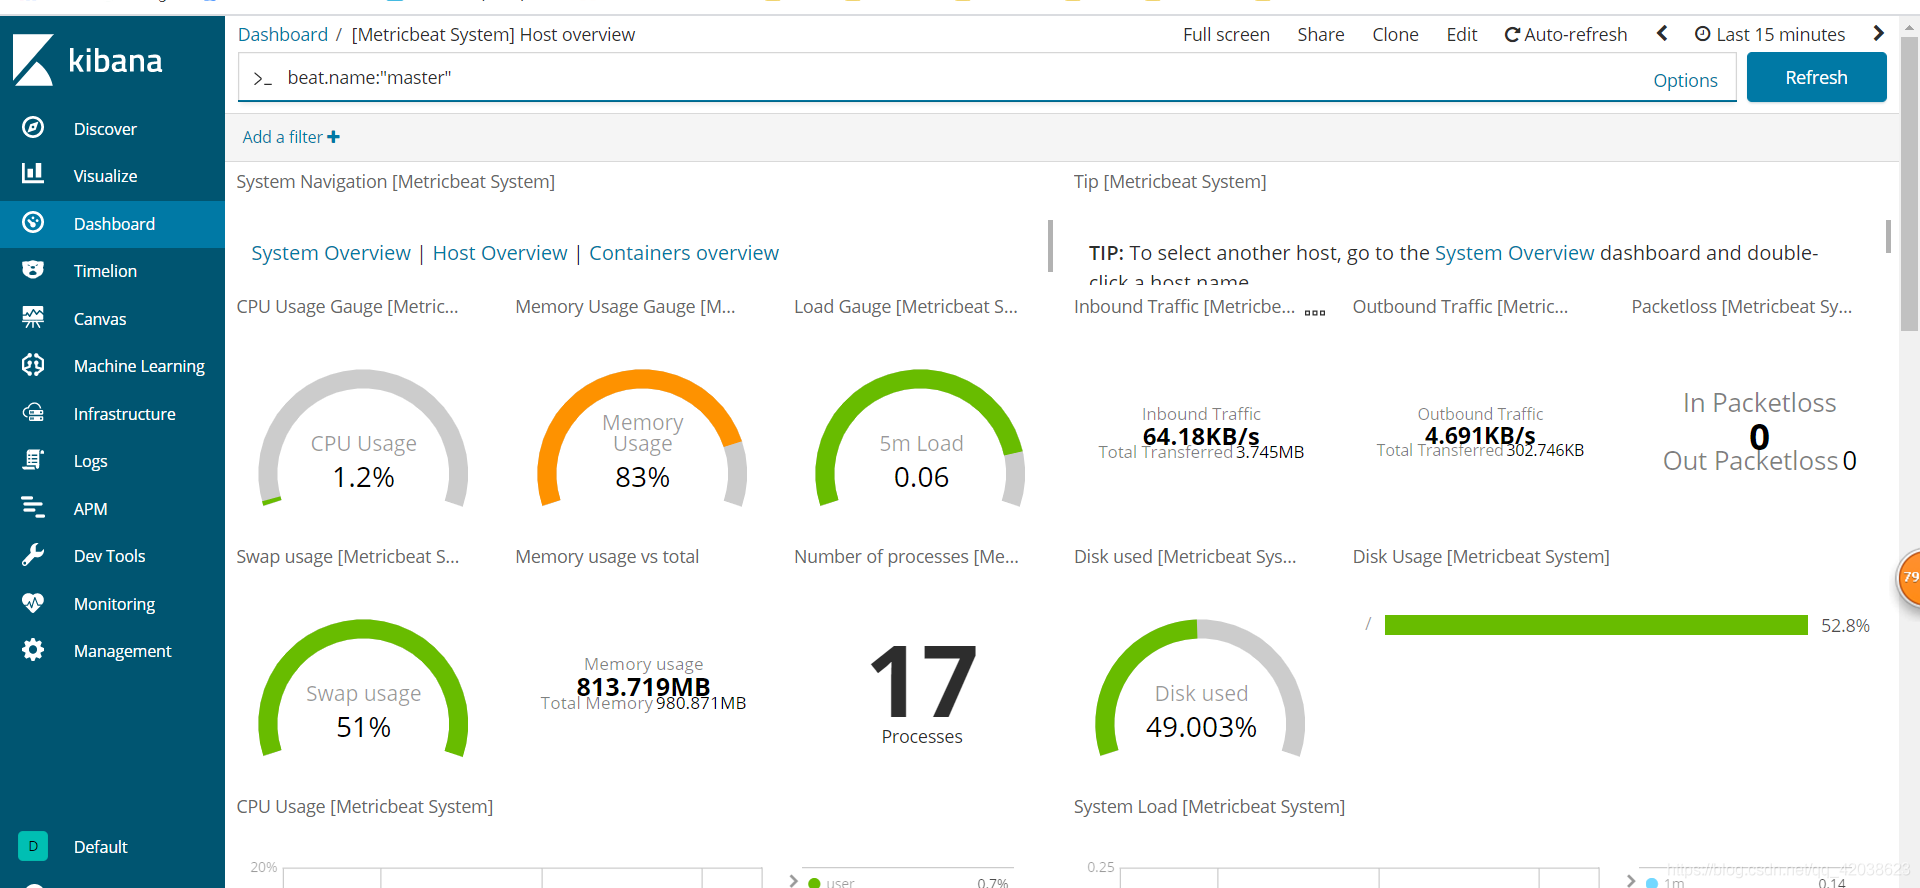
查看系统信息:
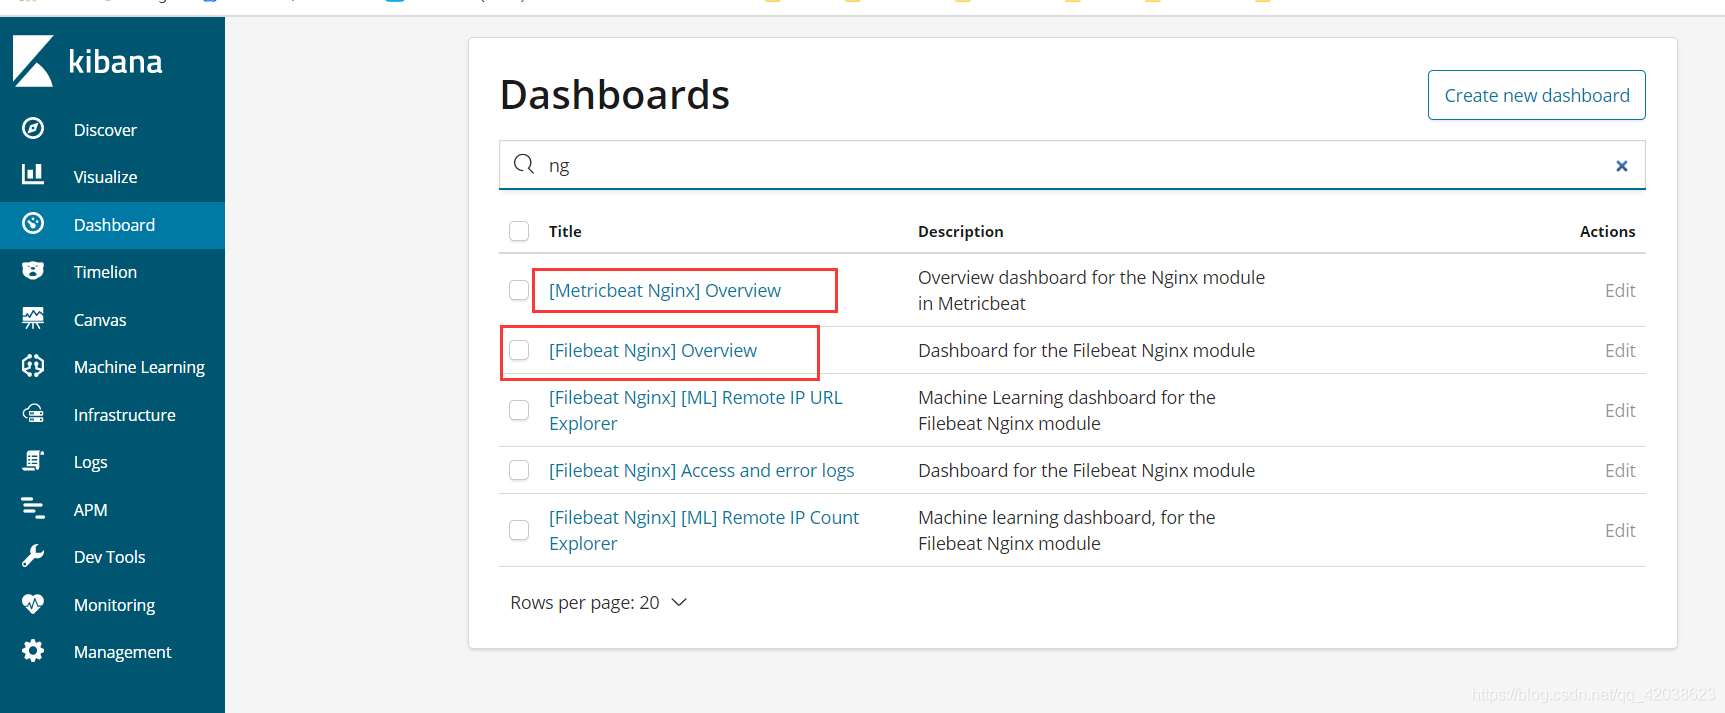
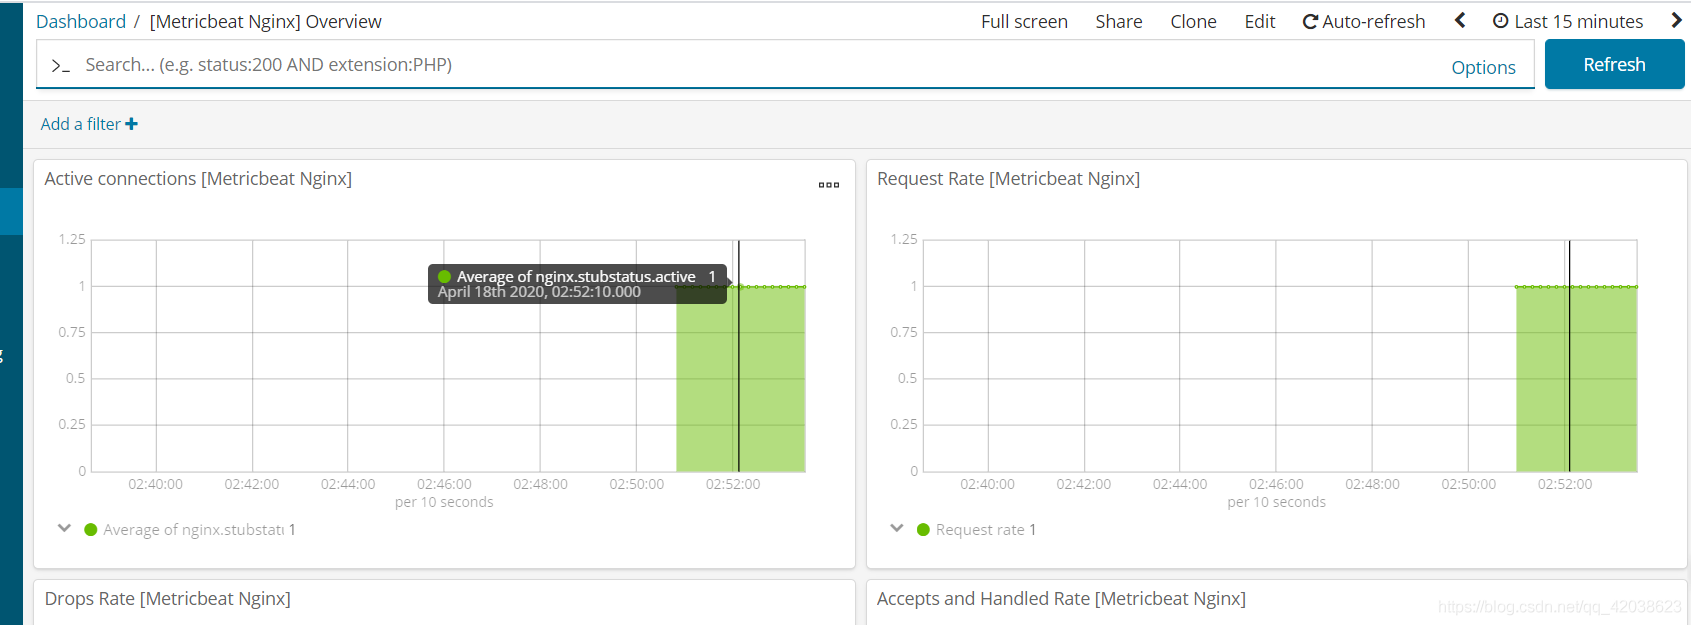
6.5、Nginx 指标仪表盘
6.6、Nginx 日志仪表盘
#修改配置文件 vim itcast-nginx.yml

filebeat.inputs:
#- type: log
#  enabled: true
#  paths:
#   - /usr/local/nginx/logs/*.log
#  tags: ["nginx"]
setup.template.settings:
  index.number_of_shards: 5
output.elasticsearch:
  hosts: ["192.168.119.129","192.168.119.130","192.168.119.131","192.168.119.132"]
filebeat.config.modules:
  path: ${path.config}/modules.d/*.yml
  reload.enabled: false
setup.kibana:
  host: "http://master:5601"
#output.console:
## pretty: true
##  enable: true

#安装仪表盘到kibana
./filebeat -c itcast-nginx.yml setup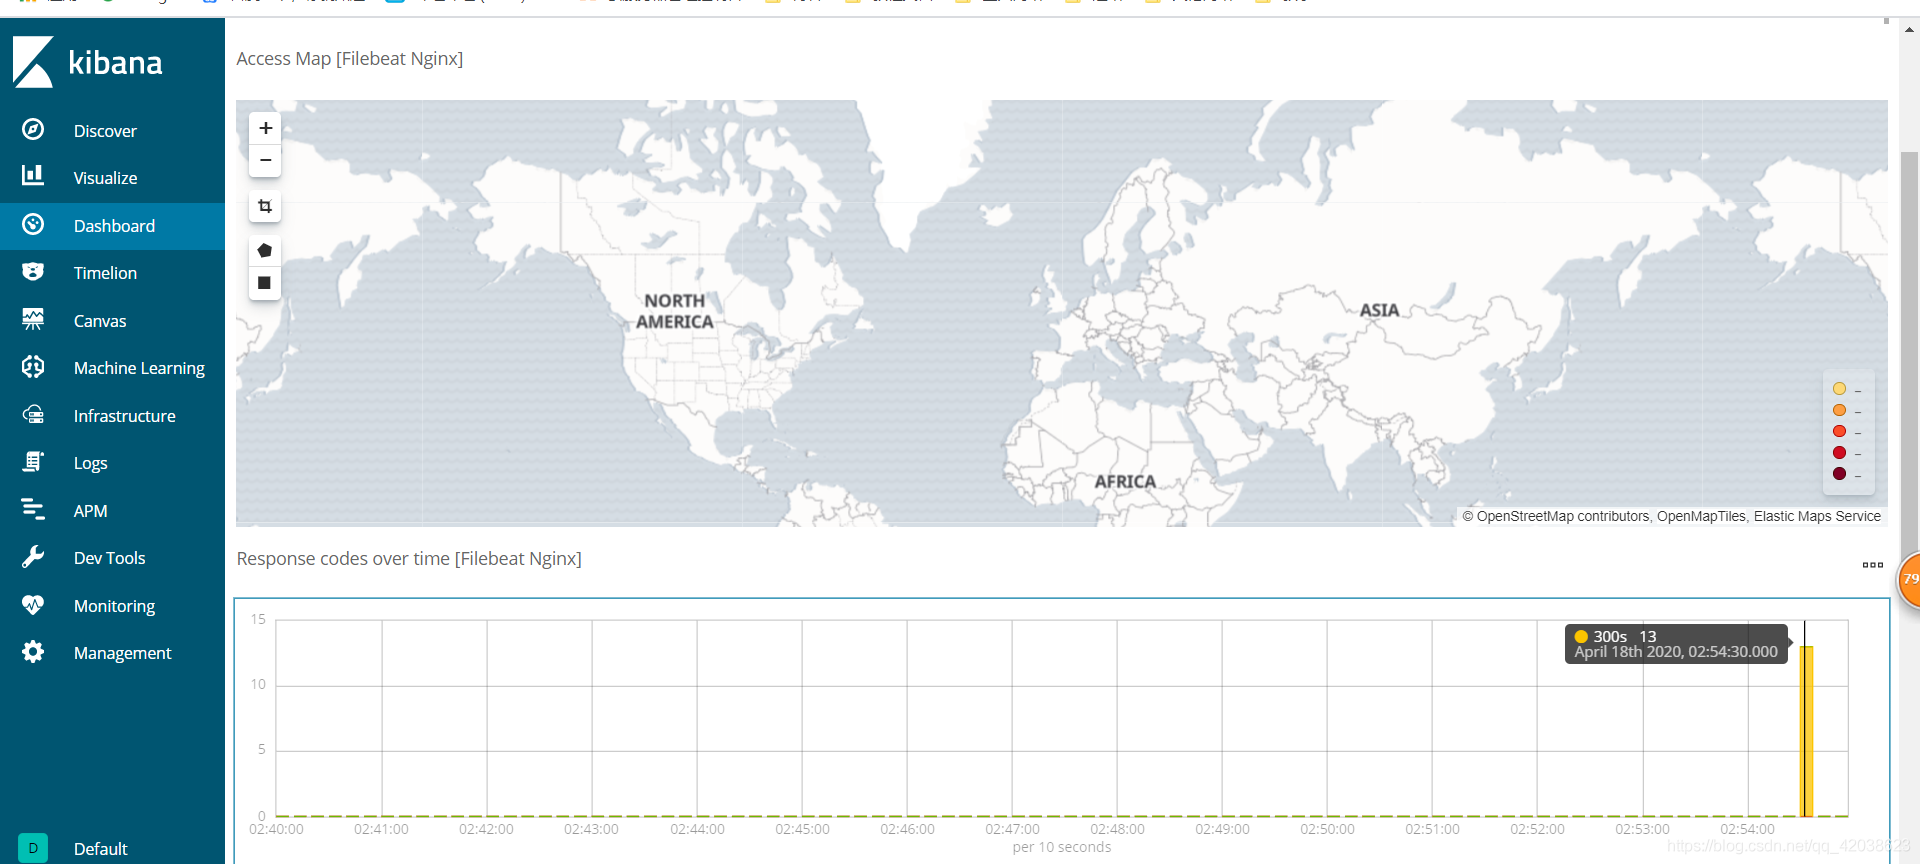
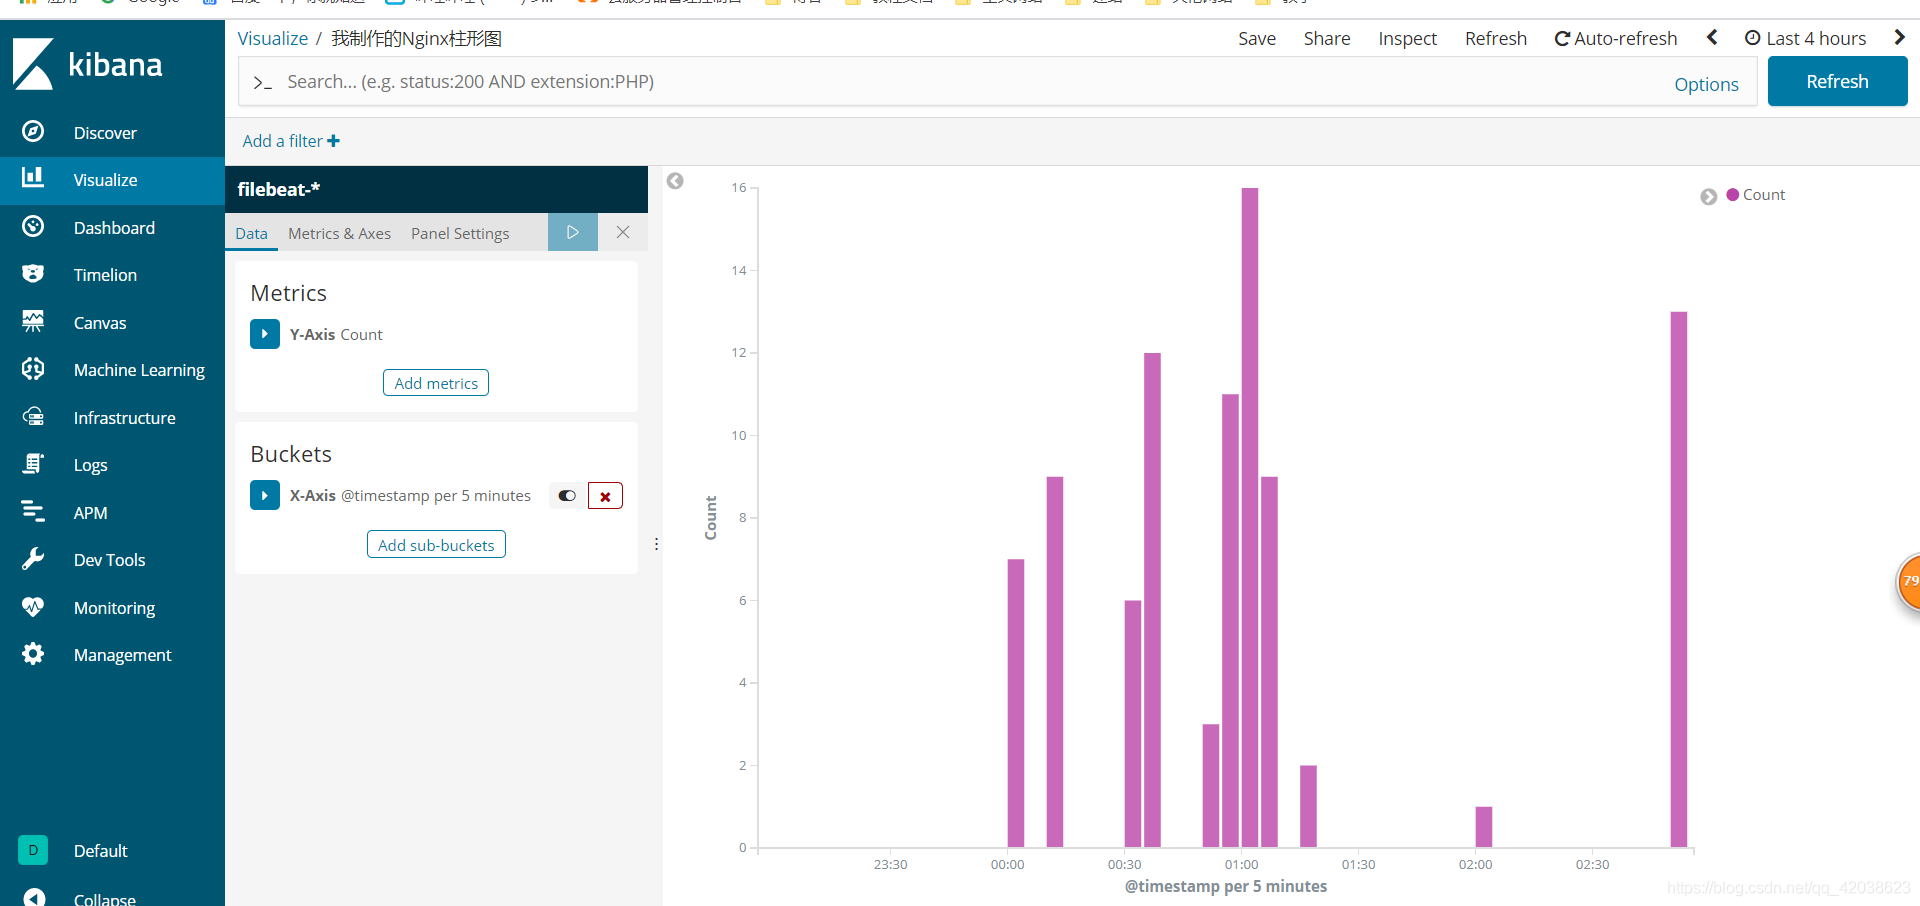
6.7、自定义图表
在Kibana中,也可以进行自定义图表,如制作柱形图:
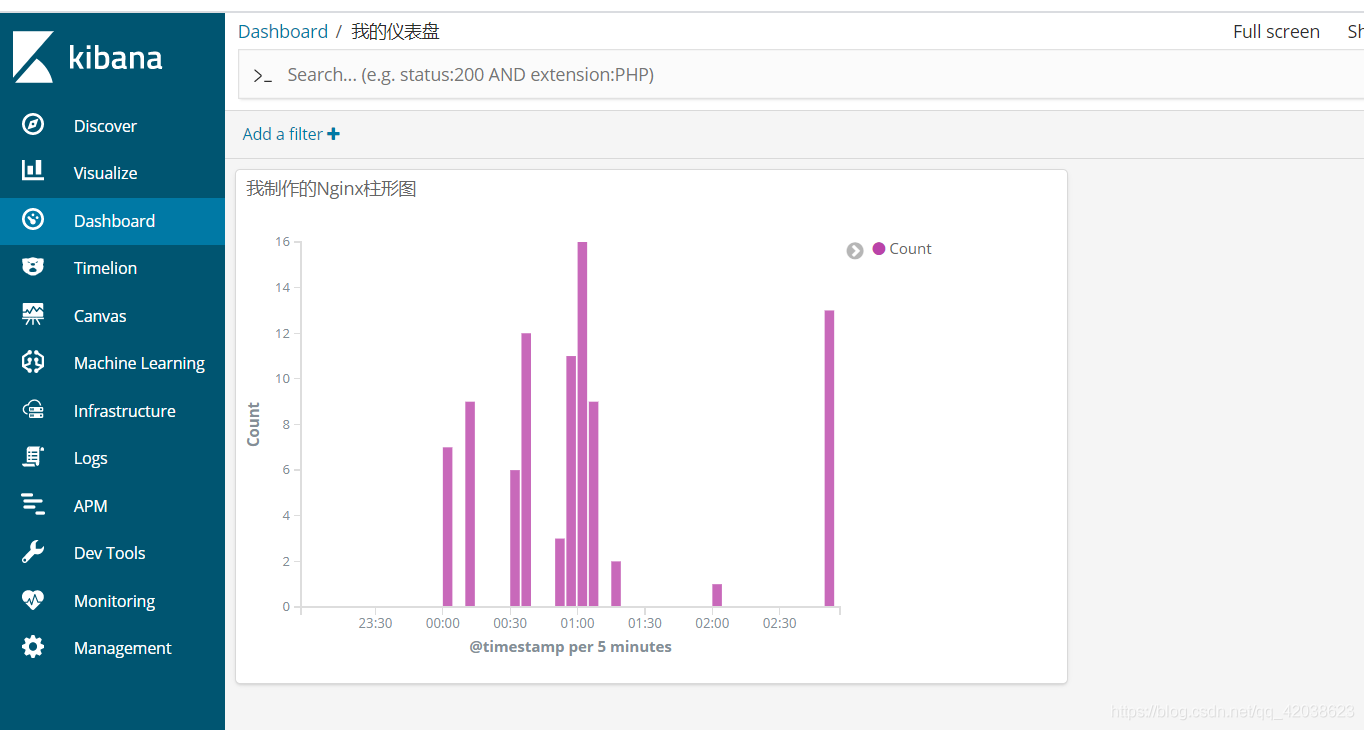
自定义仪表盘
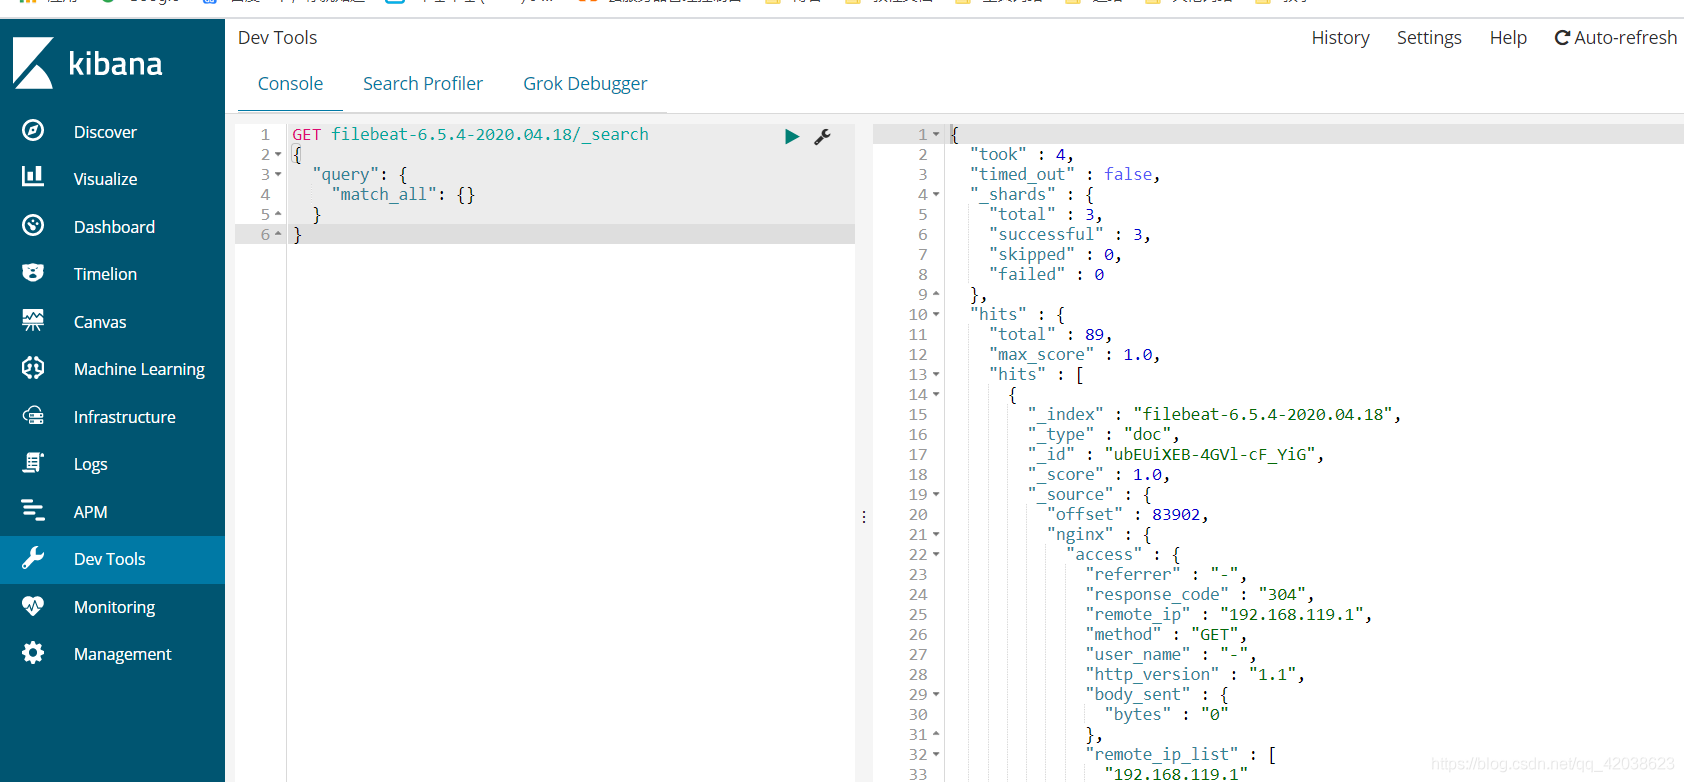
6.8、开发者工具
超好用
总结
主要实现了用Elastic Stack的系列产品对Nginx日志进行数据采集,数据存储,和数据可视化。Filebeat用于监控、收集服务器日志文件,Metricbeat用于定期收集操作系统或应用服务的指标数据。Kibana对 Elasticsearch 索引中的数据进行搜索、查看、交互操作,并且可视化展示出来。
每次nginx服务被访问都会产生日志,并实时记录,最后进行可视化展示出来。

